RESEARCH
FIR/Terahertz and low-frequency Raman spectroscopies and
quantum chemistry studies of polymers
One can say three spectroscopies, FIR, THz, and low-frequency Raman spectroscopies form low-frequency vibrational spectroscopy. In the low-frequency region bands due to stretching modes including heavy atoms, skeletal vibrations, twisting vibrations, lattice vibrations, and intermolecular vibrations appear. Band assignments in the low-frequency region are, in general, not easy. Low-frequency vibrational spectra of molecules often reflect their intramolecular and intermolecular interactions, and therefore, they have recently been utilized to investigate higher order structures of polymers and proteins, their intermolecular interactions, hydrogen bondings, hydrations and dynamics.
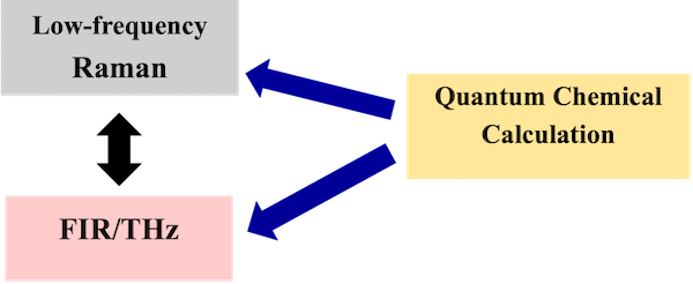
Figure 1 The strategy of the Ozaki Group for polymer research by low-frequency vibrational spectroscopy.
Our strategy for polymer research by low-frequency vibrational spectroscopy is to compare FIR/THz, and low-frequency Raman spectra and carry out quantum mechanical calculation combined with the Cartesian coordinate tensor transfer (CCT) method for band assignments (1-4). THz, FIR and Raman spectra including polarized spectra of two kinds of biodegradable polymers, poly-(R)-3-hydroxybutyrate (PHB) (1) and poly (glycolic acid) (PGA) (2) having weak hydrogen bondings and nylon 6 (3) with strong hydrogen bondings were investigated. The intermolecular interactions among the polymer chains were considered explicitly in our DFT calculations aided by fragmentation methodology (CCT method) (4).
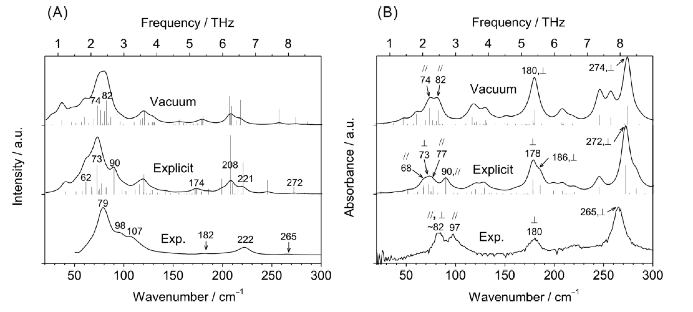
Figure 2. Bottom in (A) and (B); Raman and FIR absorption spectra of crystalline PHB, respectively. Top and middle in (A) and (B); their calculated spectra (ref.6).
Figure 2 bottom in (A) and (B) depict Raman and FIR absorption spectra of crystalline PHB, respectively, and top and middle in (A) and (B) show their calculated spectra (1). The calculations were carried out under vacuum (top) and with the explicit correction for the intermolecular interactions (middle). Of note is that the main features of both Raman and FIR spectra of PHB were reproduced by both calculations irrespective of the intermolecular interactions were considered or not. However, the explicit correction yields much better agreements between the experiments and the calculations in terms of the spectral shapes, relative intensities, and relative frequencies. Moreover, the explicit calculations and the experiments in both of the Raman and FIR spectra led Yamamoto et al. to propose the band assignments; they assigned the Raman bands at 79 and 98 cm−1 to those at 73 (out-of-plane C= O + CH3) and 90 (CH2 + CH3) cm−1 in the explicit calculation (1).
There were a lot of dispute on assignments of the low-frequency modes of nylon. Our study has provided them with defined assignments. We found a similarity in 125 and 70 cm-1 regions between crystalline polyesters and nylon 6 that both polymers show specific out-of-plane vibrational peaks around 100 cm-1, which are sensitive to the lattice length among polymer chains (1,2).
1. Yamamoto, S.; Morisawa, Y.; Sato, H.; Hoshina, H.; Ozaki, Y. J. Phys. Chem. B, 2013, 117, 2180-2187.
2. Yamamoto, S.; Miyada, M.; Y.; Sato, H.; Hoshina, H.; Ozaki, Y. J. Phys. Chem. B, 2017, 121, 1128-1138.
3. Yamamoto, S.; Onishi, E.; Sato, H.; Hoshina, H.; Ishikawa, D.; Y. Ozaki, J. Phys. Chem. B, 2019, 123, 5368-5376.
4. a) Bouř, P.; Sopková, J.; Bednárová, L.; Maloň, P.; Keiderling, T. A. J. Comput. Chem. 1997, 18, 646−659. b) Yamamoto, S.; Li, X.; Ruud, K.; Bouř, P. J. Chem. Theory Comput. 2012, 8, 977-985.