RESEARCH
Medical Applications of Raman and NIR Spectroscopy and
Applications of Raman Spectroscopy to Basic Biology
Prof. Ozaki started studies on medical application of Raman spectroscopy in 1981, when he joined Jikei University of School of Medicine. His research on medical application may be divided into three, studies at Jikei University, those in 90s at Kwansei Gakuin University and those after 2000.
Research at Jikei University School of Medicine (1981-1989)
Prof. Ozaki was truly one of the pioneers in utilizing Raman spectroscopy for exploring the development of diseases. He and Prof. Mizuno of Jikei University of School of medicine performed important achievements in the investigations of cataracts and lens aging in 1980’s by Raman spectroscopy.
I found three important changes in an eye lens with cataract formation; (a) SH groups of cysteine residues form S-S linkages in lens proteins, (b) some of buried tyrosine residues become exposed to water, (c) water content in the lens increases significantly. In the cataract and lens aging studies Prof. Ozaki demonstrated that one can monitor protein structure changes and variations in water content non-destructively for a whole eye lens.
Figure 1 shows age-dependent variations of Raman spectra in the 4000-2800 cm-1 region of rat lenses (nucleus). It is note that a broad feature in the region of 3800-3200 cm-1 decreases with aging, indicating that the water content in the lens nucleus decreases with aging. On the other hand, in the case of cataract formation the water content in a lens increases gradually.
Y. Ozaki, Appl. Spectrosc. Rev. 24, 259, 1988
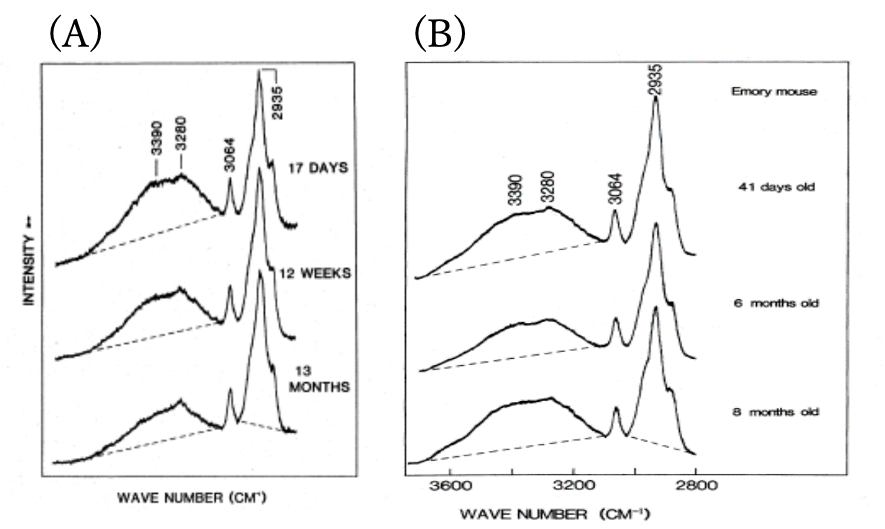
Figure 1. Age-dependent variations of Raman spectra in the 4000-2800 cm-1 region of rat lenses (nucleus).
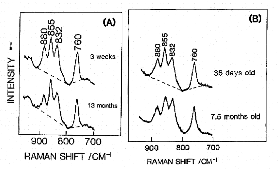
Figure 2. Age-dependent variations of Raman spectra in the 950-700 cm-1 region of rat lenses (nucleus). (A) normal aging, (B) cataract genesis.
Figure 2 (A) and (B) compare age-dependent Raman spectral variations in the 950-700 cm-1 region (tyrosine doublet region) of a normal rat lens and a cataract rat lens, respectively. Note that the intensity ratio of the tyrosine doublet (855/832 cm-1) changes for the cataract lens. This result indicated that during cataract formation some of buried tyrosine residues of lens proteins become exposed.
In 1987 Prof. Ozaki applied Raman microprobe for the studies of microstructure of gallstone. He wrote a very important review paper on Raman applications to medical studies already in 1988 (Appl. Spectrosc. Rev., 24, 259, 1988).
Research at Kwansei Gakuin University in 1990s.
Prof. Ozaki was one of the first who used NIR excitation for measuring Raman spectra of biological tissues (Neurosci. Lett.,141,47,1992). Prof. Ozaki and Prof. Mizuno of the Jikei University of School of Medicine obtained Raman spectra of various brain tissues in situ such as cerebral cortex, white matter of the cerebrum, and caudate-putamen. They extended the NIR excited Raman studies to brain tumors (J. Raman Spectrosc., 25,25,1994).
In these investigations they found many spectral changes on canceration, for example, it was found that bands due to polysaccharides increase dramatically in glioma grade III cancer and that in the case of central neurocytoma a band due to hydroxyapatite was observed at 960 cm-1, indicating that calcification occurred. Moreover, one of the neurinoma contained a carotenoid which exhibited two resonance Raman peaks at 1157 and 1524 cm-1; another neurinoma did not contain the carotenoid.
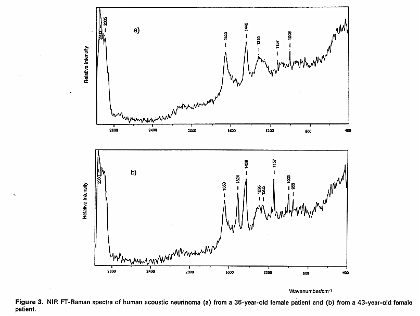
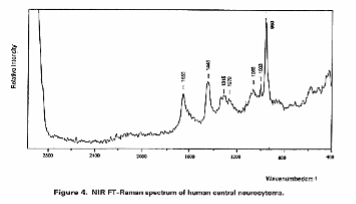
Figure 3. Raman spectra of (a), (b) human acoustic neurinoma and (c) human central neurocytoma
Research at Kwansei Gakuin University after 2000.
Prof. Ozaki contributed to a study of the Raman spectroscopic measurement process for in vivo continuous glucose monitoring by MIT group where novel analytical framework that enabled spectroscopy-based longitudinal tracking of chemical concentration without necessitating extensive a priori concentration information was used (Sci. Rep.4,7013,2014).
This study demonstrated the importance of use of state-of-the-art chemometrics in the data analysis.
Ishigaki et al. studied nondestructive diagnosis of esophageal cancer in an early stage with Raman spectroscopy. This study was started in the Prof. Sato lab. of Kwansei Gakuin University and continued at the Ozaki group.
They measured Raman spectra of esophageal cancer tissues in stage 0 and 1. The spectra changes were rathe small so that they used several chemometrics analysis such as PLS (Partial Least Squares), LDA (Linear Discriminant Analysis), and SOM (Self Organizing Maps, a kind of neural network) for diagnosis of cancer tissues (Analyst,141,1027,2016).
The chemometrics analysis suggests that glycogen, collagen, and tryptophan decrease in the cancerous tissues. The LDA validation result provided 81.0% sensitivity and 94.0% specificity for the cancer diagnosis. Ishigaki et al. conclude that Raman spectroscopy holds considerable promise in detecting early-stage esophageal cancer.
Prof. Sato (Kwansei Gakuin University), Prof. Huck (University of Innsbruck) and Prof. Ozaki et al. investigated Raman imaging of cancer tissues as an international collaboration work between Kwansei Gakuin University and University of Innsbruck). Our study aimed at extracting the paraffin component from paraffin-embedded oral cancer tissue spectra using three multivariate analysis (MVA) methods; Independent Component Analysis (ICA), Partial Least Squares (PLS) and Independent Component - Partial Least Square (IC-PLS). It was found that ICA, PLS and IC-PLS could remove the paraffin component from the spectra at almost the same level while Principal Component Analysis (PCA) was incapable.
The paraffin-removed spectra were used for constructing Raman images of oral cancer tissue and compared with Hematoxylin and Eosin (H&E) stained tissues for verification. Paraffin removed spectra were analyzed using PCA. The scores of PC1–3 were used to build the pseudo color images as shown in Figure 4B–D. Figure 6A shows the HE stained tissue image for comparison. Raman images from PC1 to 3 seem to be able to separate the cancer from the benign part where blue/pink color indicate low/high. This study has demonstrated the capability of Raman spectroscopy together with multivariate analysis methods as a diagnostic tool for the paraffin-embedded tissue section. (Sci. Rep.7,44890,2017).
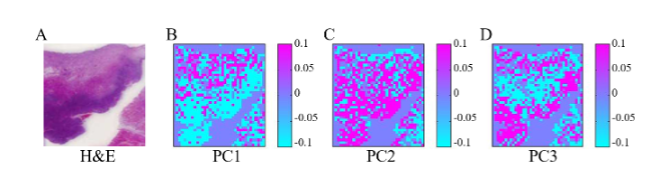
Figure 6 A. The HE stained tissue image. B-D. The color image of canser tissue build by the score of PC1-3. Paraffin removed spectra were analyzed using PCA.
Recently, many Raman spectroscopists are concerned with medical or biomedical applications of Raman spectroscopy, and its applications to biochemistry are active. However, relatively few research groups have been involved in its applications to fundamental and basic biology. Therefore, we pay attention to their applications.
Ishigaki et al. carried out interesting Raman spectroscopy studies on fundamental biology; for example, they reported non-destructive analysis of mouse embryo development and its qualitative evaluation using Raman spectroscopy (Sci. Rep. 7, 43942,2017). It was found in this study that the transition from maternal to embryonic control during development can be non-destructively profiled, thus facilitating the in-situ assessment of structural changes and component variation in proteins generated by metabolic activity.
Ishigaki et al. also investigated potential biomarkers indicating developmental competence of matured oocytes by Raman spectroscopy (Analyst,144, 1517,2019). Thsy aimed to identify biomarkers for mice oocyte maturation in metaphase II in vivo and in situ using Raman spectroscopy. Raman spectroscopy holds promise in evaluating oocyte maturation and quality based on molecular information in infertility treatment.
Surface Enhanced Raman Scattering (SERS)/ Tip Enhanced Raman Scattering (TERS)
When a light illuminates metal nanostrucutes, the excited collective oscillation of free electrons in metal, so-called localized surface plasmons, produces strongly localized and enhanced electromagnetic fields. This plasmonic fields enable the remarkable interaction between photon and molecules, leading to the measurement of single-molecule Surface Enhanced Raman Scattering (SERS). Especially, the SERS by an apex of metallic nanoscale tip easy to operate with the probe microscope technique has been developed as Tip-Enhanced Raman Scattering, which simultaneously provides the topography and molecular information of sample at the nanoscale. However, the mechanism of SERS has not yet been understood fully. We have focused on the electromagnetic and chemical enhancement for SERS mechanism. Furthermore, we have explored the noble application of SERS. Moreover, we have investigated functional nanomaterials on nanoscale using TERS.
SERS
Studies of Mechanism of SERS (Itoh et al.)
Investigations of mechanism of surface-enhanced Raman scattering (SERS) and tip-enhanced Raman scattering (TERS) and their applications to physical chemistry, analytical chemistry, and nanomaterials chemistry (a) Investigations of mechanism of SERS: We (Itoh et al.) focused on electromagnetic enhancement mechanism as general mechanism of SERS and carried out its research (25,26).
Before we started our research on this topic SERS mechanism had been investigated using an ensemble nanoparticles system. In such system, the cause of the enhancement (plasmon resonance) is averaged, and thus, it was difficult to explore directly the relation between the cause and the result (SERS). We solved this problem by use of a single nanoparticle system.
We designed a novel experimental system that enabled us to carry out scanning electron microscope (SEM) measurement, plasmon resonance measurement, and SERS measurement for the same single nanoparticle dimer. Using the experimental results obtained by this experimental setup as the calculation conditions for electromagnetic analysis, we reproduced SERS cross-section. By comparing the experimental SERS spectra with the calculated SERS spectra, we succeeded in quantitative verification of electromagnetic enhancement effect. By this study we contributed markedly to the advances in SERS.
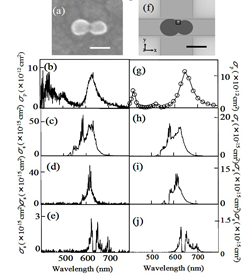
Comparison of the experimental (a-e) and calculated results (f-j). (a),(f) dimers of silver nanoparticles. (b),(g) Experimental and calculated plasmon resonance spectra. (c-e), (h-j) Experimental and calculated SERS spectra excited with 532, 561, and 633 nm.
We are a rather rare group who has explored the electromagnetic mechanisms (25,26), chemical mechanism (27), and that of semiconductor-enhanced Raman scattering (28). Studies of semiconductor-enhanced Raman scattering were started in 1982 by Prof. Haruka Yamada whom I succeeded (29). Ji et al. has worked on the mechanism of semiconductor enhanced Raman scattering (28). Recent our study on semiconductor SERS revealed that Mie resonances scattered near-field effect provided a coherence framework for modeling the electromagnetic mechanism of SERS on semiconductors (28).
(b) Applications of SERS and TERS to physical chemistry, analytical chemistry, and nanomaterials chemistry: We started applications of SERS in 1990s. One of our important SERS papers in 1990s was a report on “indirect SERS” (30). We explored enzyme immunoassay utilizing indirect SERS of the enzyme reaction product. Another interesting study was a SERS study of quantitative analysis of double-stranded DNA amplified by PCR (31).At that time, SERS of DNA was rather rare. Recently, we performed two important SRES immunoassay studies; one is “Immunoassay using probe-labelling immunogold nanoparticles with silver staining enhancement via surface-enhanced Raman scattering” (32a) and another is “label‐free indirect immunoassay using an avidin‐induced SERS substrate” (32b).
For the last 10 years so we have focused on label-free protein detections by SERS (33). One of our interesting studies is “Coupling reaction-based ultrasensitive detection of phenolic estrogens using surface-enhanced resonance Raman scattering” (34a). Another recent noticeable study is “nickel nanowires combined with SERS: application in label-free detection of cytochrome c-mediated apoptosis” (34b). Rapid label-free Cyt c quantification can be achieved by SERS with a limit of detection of 1 nM. Moreover, a recent investigation on the application of SERS to enantioselective discrimination of alcohols has been highly noted (35). A 3D SERS imaging study of polymers has also received keen interest (36).
We carried out unique studies of TERS. For example, we designed a chemically modified TERS tip for liquid TERS (37). Using this tip, nanoscale quantitative measurement of pH profile at a solid-liquid interface has been made. TERS was also employed in our group to characterize step, ridge, and crack submicro/nanostructures of epitaxial graphene on 4H-SiC (0001̅) (38). We also developed a high vacuum low temperature TERS system with Unisoku Co. Ltd. to explore nanomaterials without effects of atmosphere and thermal fluctuation.
Quantitative analysis of SERS mechanism by a single silver nanoparticle dimer measurement
It has been difficult to experimentally investigate the mechanism of SERS because SERS and plasmon resonance spectra are observed as an average value in the conventional measurement for nanoparticle ensemble system.
We have developed a single nanoparticle spectroscopy system and achieved capturing the SERS and plasmon resonance spectra of individual single metal nanoparticle dimers, enabling observation of direct optical correlation between the SERS and plasmon resonance.
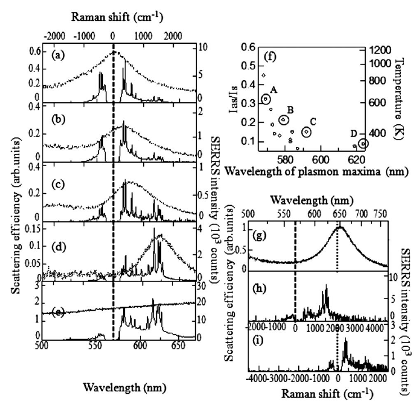
In our previous studies, we found that the spectral region where Raman obtains enhancement shifts from Anti-Stokes region to Stokes region with redshifts in plasmon resonance peaks. This changes in spectral region directly demonstrates that Raman scattering light couples with plasmon resonance on the SERS process.
This directly demonstrates that Raman scattering light couples with LSPR on the SERS process.
Blinking SERS(Kitahama et al.)
In SERS, detailed information about molecular structure and dynamics can be provided by the sharp peaks of the vibrational modes of molecules adsorbed on the noble metal nanoaggregate.
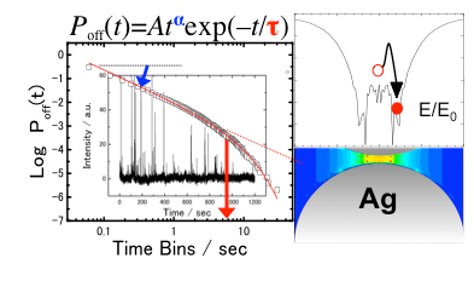
At the single molecule level, a small number of molecules randomly enter and exit the enhanced EM field at the junction and then blinking SERS takes place. Blinking SERS deteriorates the reproducibility and signal-to-noise ratio of obtained spectra. Thus, the application of SERS to single molecule detection is disturbed by the blinking. The blinking statistics of SERS have been analyzed by using a truncated power law. The truncation at the tail of the power law takes place in the dark SERS events, in an opposite way of fluorescence from a single quantum dot. The reason is that the bright SERS events is induced by the similar mechanism to the dark fluorescence events. It is noted that the truncation can be explained by non-emissive optical trapping via the periodic electromagnetic (EM) field due to coupling of multipolar surface plasmon resonance. The periodic EM field was exWe evaluated the power law exponents in bright and dark SERS are mainly influenced by the surface-plasmon-enhanced EM field and the molecular behavior on the metal surface, respectively. Moreover, the optical trapping for the single molecule at the solid-liquid interface at room temperature, which is the reason for the truncation in the power law, was detected by super-resolution imaging.perimentally observed by other group, and the excitation wavelength dependence is consistent with that of the truncation in the power law.
K. Kitahama et al., Phys. Chem. Chem. Phys. 13, pp7439–7448 (2011).
K. Kitahama et al., J. Phys. Chem. C 117, pp9397–9403 (2013).
Y. Kitahama et al., Phys. Chem. Chem. Phys. 17, pp21204—21210 (2015)
Y. Kitahama et al., J. Phys. Chem. C 123, pp18001—18006 (2019)
Enhanced Raman Scattering by ZnO Superstructures:
Synergistic Effect of Mie Resonance and Charge-Transfer
We have worked the mechanism of semiconductor enhanced Raman scattering (Chem. Sci.,6,342,2014).
It has been found in this study that Mie resonances scattered near-field effect provided a coherence framework for modeling the electromagnetic mechanism of SERS on semiconductors. A remarkable enhancement of Raman scattering was achieved by submicron-sized spherical ZnO superstructures.
Mie scattering was strongly enhanced by the secondary structure of the ZnO superstructures, leading to an electromagnetic contribution to the SERS enhancement.
Meanwhile, the charge-transfer contribution derived from the primary structure of the ZnO nanocrystallites was able to enhance the SERS signals as well. The highest Raman enhancement factor of 105 was achieved for a non-resonant molecule probe by a synergistic effect of Mie resonances and charge-transfer.
The Mie resonances scattered near-field effect investigated in this study provided an important guide for designing novel SERS-active semiconductor substrates, but also a coherent framework for modelling the electromagnetic mechanism of SERS on semiconductors.
W. Ji et al., Angew. Chem. Int. Ed., 2019, 58, 14452-14456. top 5% VIP paper, cover article.
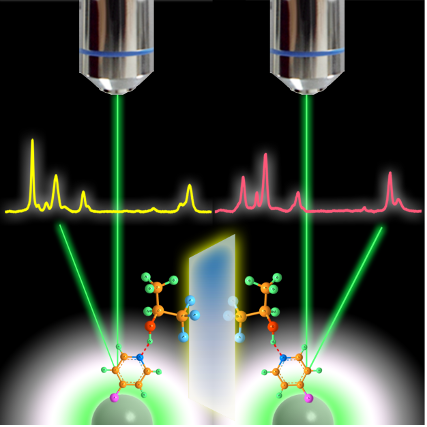
Enantioselective discrimination of alcohols by hydrogen bonding: a SERS study
Molecular chirality is critical in various fields of science and technology, and enantiomers of a chiral molecule may exhibit striking different characteristic.
Herein, efficient, generic and label-free enantioselective discrimination of various chiral alcohols is demonstrated by using surfaced-enhanced Raman scattering (SERS) spectroscopy through charge-transfer (CT) contributions. The relative intensities of the chiral selector (MPY) are strongly dependent on the chirality of its surroundings.
This highly distinct spectral discrepancy which may be due to the tendency of chiral isomers to form intermolecular hydrogen-bonding complexes with MPY in different molecular orientations, resulting in different CT states. This study opens a new avenue leading to the development of novel enantiosensing strategies.
[1] Yue Wang et al., Angew. Chem. Int. Ed., DOI: 10.1002/anie.201407642R1.
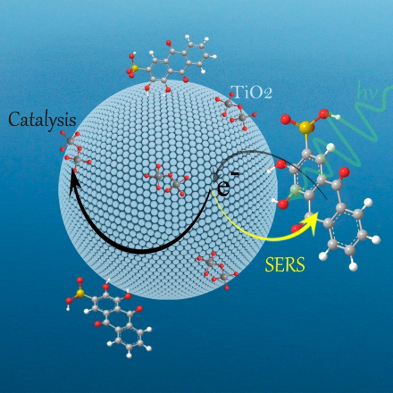
Development of novel SERS sensing platform based on chemical enhancement contribution
Semiconductor materials have been successfully used as surface-enhanced Raman scattering (SERS)-active substrates, providing the SERS technology with a high flexibility for application in a diverse range of fields.
Here, we present a novel “turn-off” SERS strategy for metal ions detection based on the optical and catalysis properties of semiconductor. In particular, we demonstrate its use in a SERS-based assay for the determination of Chromium(VI) in water. The present work provides a viable and clever application for semiconductor-enhanced Raman spectroscopy based on chemical enhancement contribution.
[1] W. Ji et al., Chem. Sci., 2014 2014, 6, 342.
[2] W. Ji et al. J. Raman. Spectrosc. 2020, DOI:10.1002/jrs.5975.
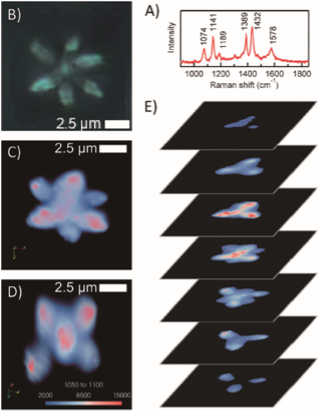
Other SERS studies
Ozaki et al. have investigated other SERS application for the last dozen years; for example, SERS from the Ag nanoparticles formed by near-field photo-reduction [1], three-dimensional SERS imaging in polymer film [2], surface-enhanced hyper Raman scattering via optically trapped Ag nanoaggregate [3], the CT mechanism in dye-sensitized solar cell [4], functional nanomaterials with enzyme-like characteristics for SERS sensing [5]. Figure shows the 3D imaging in polymer film.
[1] Y. Kitahama, et al., Chem. Commun. 2014, 50, 9693.
[2] S. Vantasin, et al., Angew. Chem. Int. Ed., 2016, 55, 8391.
[3] Y. Kitahama, et al., Analyst, 2017, 142, 3967
[4] X. Wang, et al., J. Phys. Chem. C. 2018, 122, 12748.
[5] W. Song, et al., J. Materials. Chem. 2019, 7, 850.
TERS
Basic studies (Kitahama et al.)
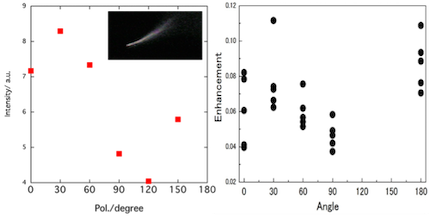
Enhancement factors for tip-enhanced Raman scattering (TERS) strongly depend on the tip, and the poor reproducibility may be originated from change of the tip. Therefore, we have tried reproducing the enhancement factors via experimental dependence of the plasmon scattering spectra and calculation for electromagnetic analysis.
By conventional dark-field illumination, plasmon resonance scattering spectra from the tip were measured. The polarization angle dependence of the scattering spectra is consistent with that of TERS enhancement factors. The dependence can be applied to three-dimensional direction of the polarization.
In the calculation, our technique is designed to omit unrealistic results.
T. Itoh et al., Appl. Phys. Lett. 108, 021604, (2016).
Y. Kitahama et al., Appl. Phys. Lett. 110, 233104, (2017).
Y. Kitahama et al., Spectrochimica Acta A, 197, 142, (2018).
Tip enhanced Raman Scattering (TERS) spectroscopy of epitaxial graphene
Epitaxial graphene is a unique type of graphene synthesized by sublimation of silicon atoms out from SiC surface and let carbon atoms form as graphene. Graphene synthesized by this method has promisingly low defect, large sheet area, and good compatibility for electric circuit.
One of the unique properties of epitaxial graphene is the nanostructures from strain inhomogeneity in the nanoscale, which leads to opportunities such as strain engineering. Our research focusing on using tip-enhanced Raman scattering (TERS) spectroscopy to probe these features. The excellent spatial resolution of TERS allows the investigation of strain and defect on epitaxial graphene in nanoscale, which normal Raman spectroscopy is not capable. Therefore, in-depth information of each individually nanostructure can be acquired.
[1] T. Suzuki et al., Phys. Chem. Chem. Phys. 16, pp20236–20240 (2014).
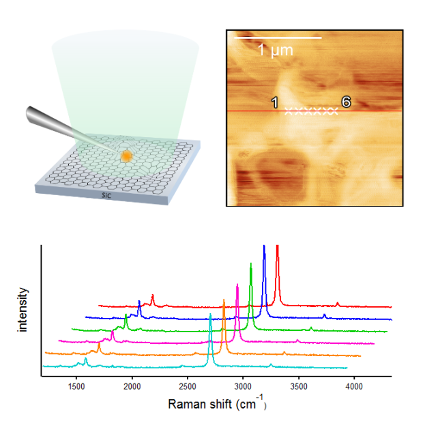
Tip-enhanced Raman spectroscopy study of local interactions at the interfacial of polymernanocomposites
Recently, various kinds of nanomaterials have been used as fillers to reinforce the physical properties of polymers; these mixtures are called polymer nanocomposites. Nanocomposite is expected as future functionalized polymer in many ways.
However, the mechanism by which the properties are improved has not been fully elucidated because the interactions in nanocomposites occur at the interface between a polymer and fillers. Normal Raman experiments can determine only average information.
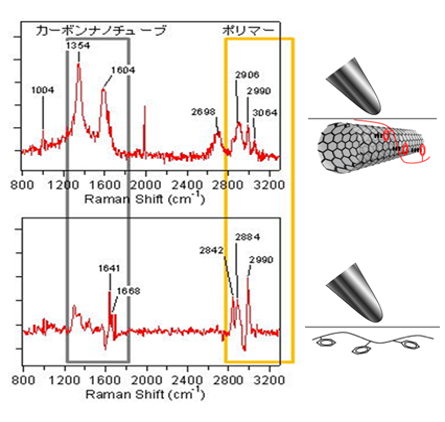
TERS spectroscopy has a high spatial resolution within several tens of nanometers in scale. Therefore, we have selectively obtained spectra of local structure of nanocomposites with TERS. So far in our group, orientation change is observed due to the π−π interaction between the phenyl rings and carbonnanotube. Moreover, this interaction affects the orientation of the phenyl rings, leading to a modification of the local orientation of the polymer chains.
[1] T. Suzuki et al., J. Phys. Chem. C 117, pp1436–1440 (2013).
Nanoscale pH Profile at a Solution/Solid Interface by Chemically Modified TERS Tip:
Most of the TERS studies have been performed on solid samples. Because of some limitations, such as problems with laser focusing, sample preparation, the feedback system of SPM, and adsorbed contaminants on the TERS tip, relatively few TERS studies have been attempted for solution/liquid systems. Pienpinijtham et al. reported a nanoscale pH profile on a 4 © 4¯m2 area of a NH2-anchored glass slide in an aqueous solution using chemically modified TERS.
A pH change in the solution could be detected by the peak at 1422cm¹1 due to the COO¹ stretching vibration mode of p-mercaptobenzoic acid (pMBA) bonded to the tip surface and that at 1442cm¹1 due to the N=N stretching vibration mode arising from the formation of 4,4¤dimercaptoazobenzene (DMAB) on the p-aminothiophenol (pATP)-modified tip.
Figure 35A shows pH-dependent TERS spectra obtained from the pMBA modified tip apex immersed in buffer solutions. Two strong peaks at 1586 and 1079cm¹1 are assigned to the ring-breathing modes while the weak ones at 1422 and 1370cm¹1 come from to the stretching vibration modes of the carboxylate (COO¹) group. The ratio of two peak areas at 1422 and 1586cm¹1 versus the solution pH is plotted in Figure 35B.154 The peak area ratio changes little in the pH range of 16, but it begins to increase drastically in the pH range of 79, suggesting that the proton dissociation of pMBA (COOH to COO¹) occurs in this pH range. From the result of Figure 35B, the pKa of pMBA in this system was determined to be 7.85, and the proton dissociation constant (Ka) of pMBA equals 1.41 © 10¹8.154
It is well-known that pATP can form DMAB in several ways, including catalytic coupling reactions, surface-induced photoreactions, and pH-dependent reactions. TERS spectra collected from a pATP-modified tip apex immersed in buffer solutions showed pH-dependent spectral variations.154 The peak at 1442cm¹1 in the spectra was assigned to the N=N stretching vibration mode while that at 1079cm¹1 was ascribed to the CS stretching vibration mode.
TFigure 36 plots the ratio of the two peak areas at 1442 and 1079cm¹1 versus the pH of the solutions, confirming the formation of DMAB. The N=N coupling was initiated in the pH range of 12. The plot showed that at a pH > 2 the peak at 1442cm¹1 slightly increased with an increase in pH. This revealed that DMAB is more stable at higher pHs. It was found that the measured pH becomes the pH of the bulk solution when the tip was located ca. 200nm from the surface.154 This technique suggests a possibility for the pH sensing in wet biological samples. TERS tips could also be chemically modified with other molecules to determine other properties in a solution.
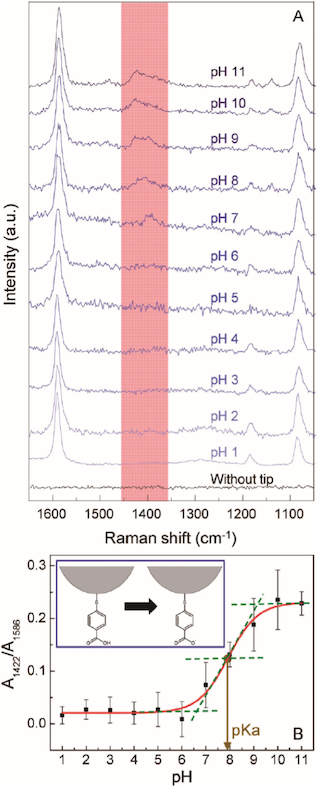
(A) pH-dependent TERS spectra obtained from the pMBA modified tip apex immersed in buffer solutions. (B) The ratio of two peak areas at 1422 and 1586cm¹1 versus the solution pH. [Reprinted with permission of Ref. 154]
- 1. Medical Applications of Raman and NIR Spectroscopy and
Applications of Raman Spectroscopy to Basic Biology - 1.1 Research at Jikei University School of Medicine (1981-1989)
- 1.2 Research at Kwansei Gakuin University in 1990s.
- 1.3 Research at Kwansei Gakuin University after 2000.
- 2. Surface Enhanced Raman Scattering (SERS)/ Tip Enhanced Raman Scattering (TERS)
- 2.1 SERS
- 2.2 Quantitative analysis of SERS mechanism by a single silver nanoparticle dimer measurement
- 2.3 Blinking SERS(Kitahama et al.)
- 2.4 Enhanced Raman Scattering by ZnO Superstructures:
Synergistic Effect of Mie Resonance and Charge-Transfer - 2.5 Enantioselective discrimination of alcohols by hydrogen bonding: a SERS study
- 2.6 Development of novel SERS sensing platform based on chemical enhancement contribution
- 2.7 Other SERS studies
- 2.8 TERS
- 2.9 Tip enhanced Raman Scattering (TERS) spectroscopy of epitaxial graphene
- 2.10 Tip-enhanced Raman spectroscopy study of local interactions at the interfacial of polymernanocomposites
- 2.11 Nanoscale pH Profile at a Solution/Solid Interface by Chemically Modified TERS Tip:
CONTENTS